For the modern airport executive, the view from the C-suite is too often obscured by a fog of data. Consider a typical Tuesday. Your Airport Operations Control Center (APOC) is simultaneously tracking a surge in international arrivals, a deepening bottleneck at Security Checkpoint 3, and a delayed turnaround at Gate B12 that is quietly building into a cascading schedule to collapse. Three problems. Three different systems. Three teams operating without a shared picture of what is happening and more critically, what is about to happen next.
The data to resolve every one of those scenarios already exists. It is flowing in real time through your Airport Operational Database (AODB), your baggage handling sensors, your retail tenant systems, and your passenger processing platforms. The problem is not a shortage of data. The problem is that this data remains trapped in functional silos — inaccessible to the leaders who need it most, at the exact moment they need it. You are surrounded by information and yet unable to act on it with the speed and confidence the situation demands. As we move deeper into 2026, that gap is no longer just an IT headache. It is a strategic liability with a measurable cost.
A single unplanned Aircraft on Ground (AOG) event can cost upward of USD 100,000 per hour. A preventable security queue spike erodes passenger satisfaction scores that take quarters to rebuild. A missed commercial signal in your load factor data translates directly to yield left on the table. The executives closing these gaps are not doing it with more reports or bigger teams they are doing it by finally connecting their data. That is exactly what we have built a customized dashboard for aviation analytics.
The Data Explosion in Aviation: Why Dashboards Matter More Than Ever
The scale of investment flowing into aviation analytics tells you everything about where the industry is heading. The global aviation analytics market was valued at approximately USD 3.8 billion in 2025 and is projected to reach USD 9.1 billion by 2035, growing at a steady CAGR of 9.2% (Future Market Insights, 2025). That’s not just market noise — that’s the industry collectively acknowledging that the executives who win in the next decade will be the ones who act on data fastest.
The data volume is not the challenge — airports and airlines already generate enormous streams of information every hour, from passenger flows and gate utilization to fuel consumption logs, baggage handling records, on-time performance, and revenue per available seat mile. What has historically been missing is a layer of intelligence that sits above all of it: one that connects these streams, contextualizes them against your strategic KPIs, and surfaces the insight that actually drives a decision.
An aviation executive dashboard is that intelligence layer. It does not replace your existing systems it sits above them, translating raw operational data into a unified, real-time command view that is built for how executives actually think and decide. Less noise. More signal. Faster action.
What’s Happening Right Now in Aviation Analytics
The industry is moving fast. Cloud-based deployments captured over 67% of aviation analytics spending in 2025, as carriers shifted legacy workloads to scalable cloud environments capable of processing millions of data points per hour (Mordor Intelligence, 2025).
Meanwhile, IBM expanded its AI-driven predictive maintenance partnership with Delta Air Lines in June 2024 with the goal of reducing unscheduled maintenance downtime by 20–30% across a fleet of 800+ aircraft (Straits Research, 2024). Boeing agreed to divest parts of its Digital Aviation Solutions business for USD 10.55 billion in April 2025, signaling a strategic industry-wide refocus on analytics infrastructure (Mordor Intelligence, 2025).
The strategic shift is already underway. The question every aviation leader now needs to answer is not whether connected data intelligence matters it is whether their organization is positioned to act on it before the competition does.
The Real Pain Points Aviation Executives Face Every Day
Before we get into what an aviation executive dashboard can do, let’s talk honestly about the pain points that prompted executives to seek one in the first place.
1. Disconnected Data, Disconnected Decisions
Operations, finance, commercial, ground handling, and customer experience teams each have their own systems — and none of them talk to each other in real time. Executives spend hours each week reconciling reports instead of acting on them. By the time a single consolidated view is ready, the moment for action has passed.
2. Reactive, Not Proactive, Operations
Most airport and airline operations are built to respond to problems, not anticipate them. Delays compound, fuel costs balloon, and passenger satisfaction scores take a hit — all because the warning signs were buried in data that no one was watching in real time. Without predictive analytics, you’re always a step behind.
3. KPIs That Don’t Connect to Revenue
On-time performance. Turnaround time. Passenger load factors. These metrics are tracked religiously — but rarely connected to their actual financial impact in a single view. Executives can’t quickly answer: “What did that 12-minute delay actually cost us today?” That disconnect makes it nearly impossible to build a business case for operational improvements.
💡 The biggest competitive risk in aviation today isn’t disruption — it’s the slow leak of efficiency caused by decisions made without complete data.
Top 3 Use Cases for an Aviation Executive Dashboard
When airport and airline data finally connects, these are the three areas where Hexalytics customers see the most immediate and measurable impact:
Use Case 1: Airport Operations Analytics & Real-Time Situational Awareness
From gate utilization to runway throughput, terminal congestion to baggage claim wait times — a unified airport operations dashboard gives your team a live, color-coded picture of everything happening across the terminal, right now.
Executives and operations managers can monitor key airport performance indicators (KPIs) like aircraft turnaround time, security queue length, passenger dwell time, and resource utilization — all on one screen. When something goes off-plan, the system flags it. When patterns emerge, you can act before they become problems.
- Key analytics covered: gate conflict detection, ground crew deployment, baggage handling SLA tracking, terminal flow heatmaps, aircraft on ground (AOG) alerts
Use Case 2: Revenue & Commercial Performance Monitoring
Every seat, every ancillary revenue stream, every route — revenue management is only as good as the data behind it. Hexalytics connects your PMS, PSS, and financial systems to surface real-time revenue per available seat mile (RASM), yield trends, route profitability, and load factor analysis in a single executive view.
Instead of waiting for end-of-month reports, commercial leaders can spot underperforming routes mid-week, assess the impact of a competitor’s pricing move in real time, and course-correct while there’s still time to act.
- Key analytics covered: load factor, RASM, route profitability, ancillary revenue, yield management trends, seasonal demand forecasting
Use Case 3: Passenger Experience & Service Quality Analytics
Passenger expectations have never been higher, and a single negative experience can generate a wave of online sentiment that takes weeks to manage. Hexalytics pulls together NPS data, service desk logs, flight disruption records, social sentiment, and app feedback to give you a 360-degree passenger experience dashboard.
Understand exactly where the experience breaks down — whether it’s at check-in, boarding, baggage reclaim, or during a disruption — and fix it before it becomes a headline.
- Key analytics covered: NPS tracking, disruption impact scores, service recovery rates, passenger complaint categorization, real-time satisfaction signals
Key Analytics That Power Smart Aviation Decisions
A well-designed aviation executive dashboard doesn’t just visualize data — it surfaces the right metrics at the right level of granularity for the right stakeholder. Here’s a quick overview of the analytics pillars Hexalytics covers:
- Operational Analytics: On-time performance (OTP), turnaround KPIs, slot utilization, airside/landside resource allocation
- Financial Analytics: Revenue trends, cost per departure, fuel spend variance, EBITDA impact of delays
- Safety & Compliance Analytics: Incident frequency tracking, audit readiness, regulatory reporting dashboards
- Passenger Analytics: Traffic flow forecasting, experience scoring, loyalty segment behavior
- Predictive Analytics: Delay prediction models, demand forecasting, maintenance scheduling optimization
- Sustainability Analytics: Carbon emissions tracking, fuel efficiency benchmarking, sustainability KPI reporting
Each of these analytics modules is designed to work independently — but the real magic happens when they work together. That’s when patterns emerge that no single report would ever surface on its own.
The Shift from Data Chaos to Decision Intelligence
The aviation executives who will lead the next decade aren’t the ones with the most data — they’re the ones who can act on it the fastest. That requires more than a good BI tool. It requires an aviation-specific analytics platform that understands the unique complexity of airports and airlines: the interlocking systems, the real-time pressures, the regulatory requirements, and the commercial dynamics that are entirely unlike any other industry.
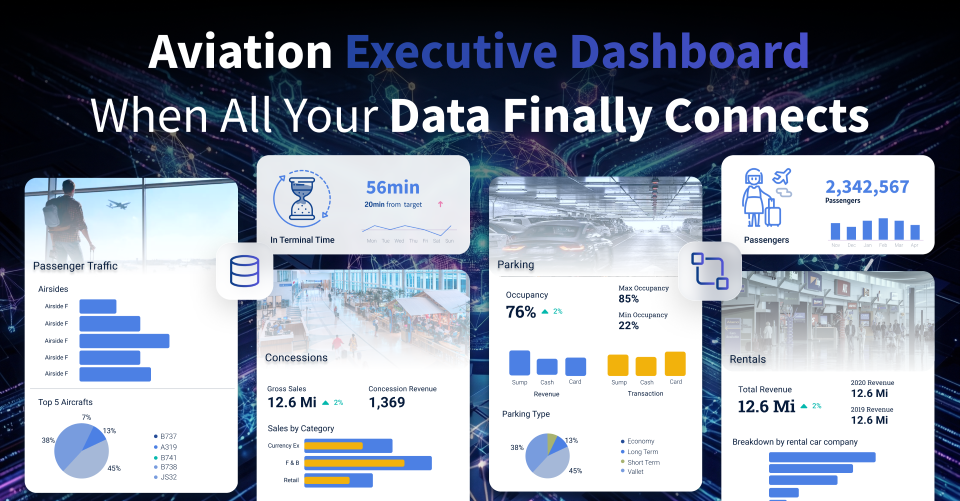
When all your data finally connects — operations, revenue, passengers, finance, safety — something powerful happens. Decisions get faster. Teams get aligned. Costs come down. Passenger satisfaction goes up. And you, as an executive, finally have a clear line of sight across every part of your business at once.
That’s not a futuristic vision. That’s what Hexalytics is delivering to aviation leaders today.
About Hexalytics
Hexalytics is a specialized aviation analytics platform built for airports, airlines, and aviation authority executives who need real-time, unified visibility across operations, commercial performance, and passenger experience.
We connect your existing data ecosystem — from PSS and AMS to FIDS, finance, and customer systems — into a single executive dashboard that’s live, configurable, and built for the pace of aviation decision-making. Whether you’re managing a regional airport or a multi-hub network, Hexalytics scales with your complexity.
Our clients don’t just get dashboards. They get decision intelligence — the ability to see what’s happening, understand why, predict what’s next, and act before it’s too late.
Key Takeaways
- The Data Explosion in Aviation: Why Dashboards Matter More Than Ever
- What’s Happening Right Now in Aviation Analytics
- The Real Pain Points Aviation Executives Face Every Day
- Top 3 Use Cases for an Aviation Executive Dashboard
- Key Analytics That Power Smart Aviation Decisions
- The Shift from Data Chaos to Decision Intelligence
- About Hexalytics